Our Quality Measures
Risk-Adjusted analyses calculate the following metrics:
- Observed
- Expected
- O/E
These metrics are calculated for the following outcomes:
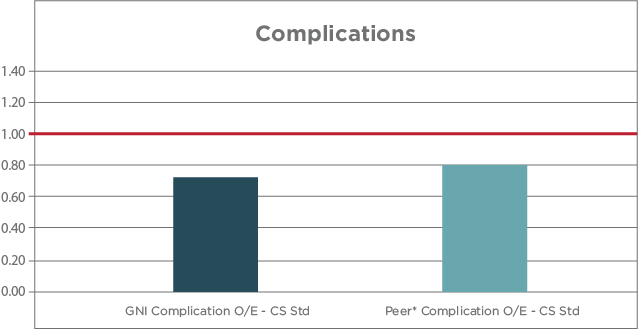
- Complications
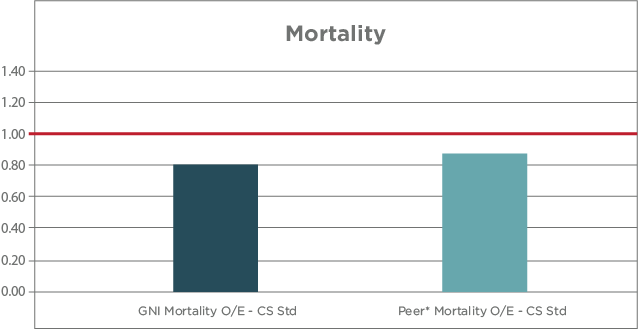
- Mortality
Observed - Observed values are the actual rate for the Outcome Cases.
Expected - This is the Expected value for the Outcome Cases based on the risk adjustment methodology: 3M™ or CareScience Analytics.
O/E (Observed to Expected) - O/E is the Observed value (O) divided by the Expected value (E).
- Outcomes with an O/E less than 1.0 are performing better than expected.
- Outcomes with an O/E greater than 1.0 are performing worse than expected.
Stroke Data
Carotid Data
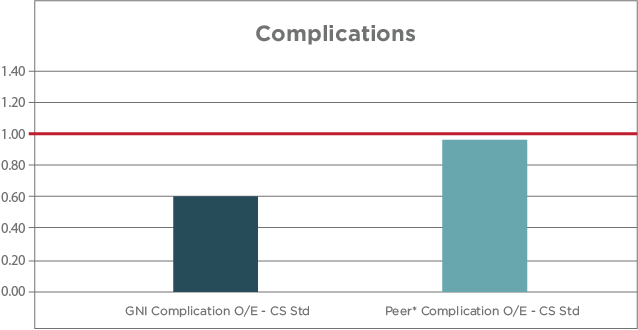
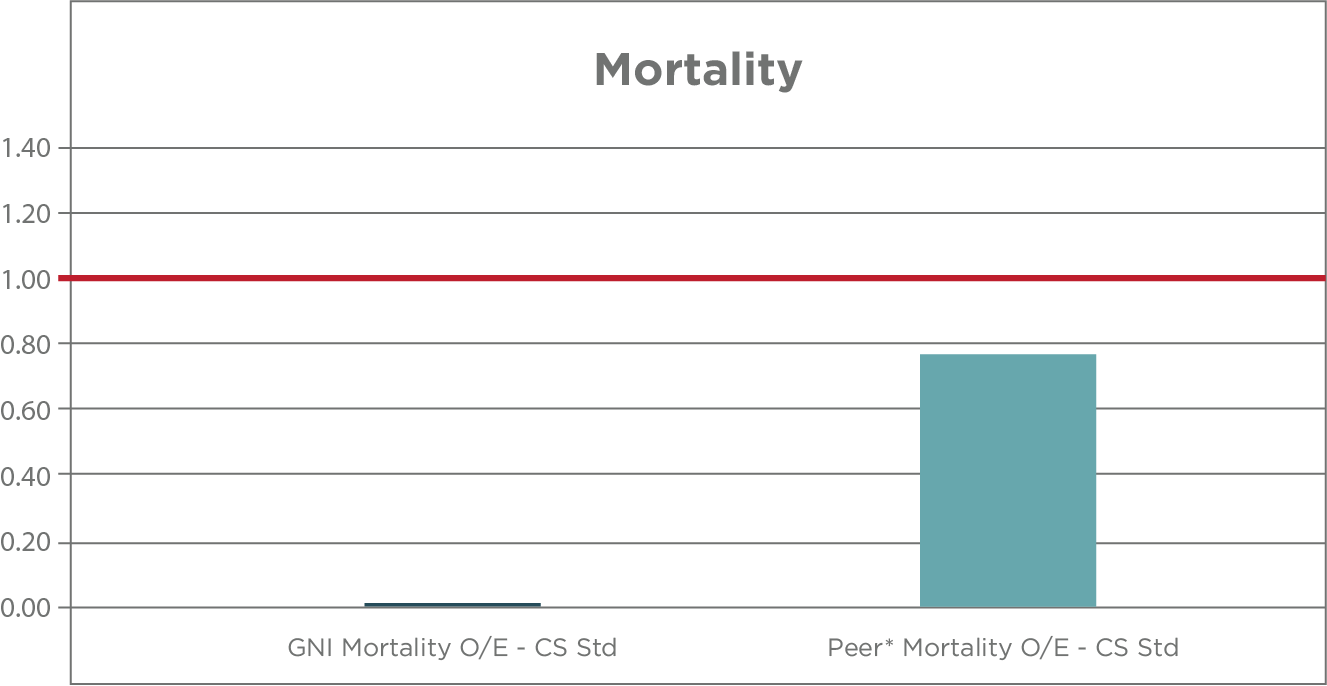
*Peer Group Hospitals
- Hartford Hospital
- Banner University Medical Center Phoenix
- George Washington University Hospital
- Cooper Health System
- St. Luke's Hospital - Bethlehem Campus
- Geisinger Medical Center
- Einstein Medical Center - Philadelphia
- Abington Hospital - Jefferson Health
- Thomas Jefferson University Hospital